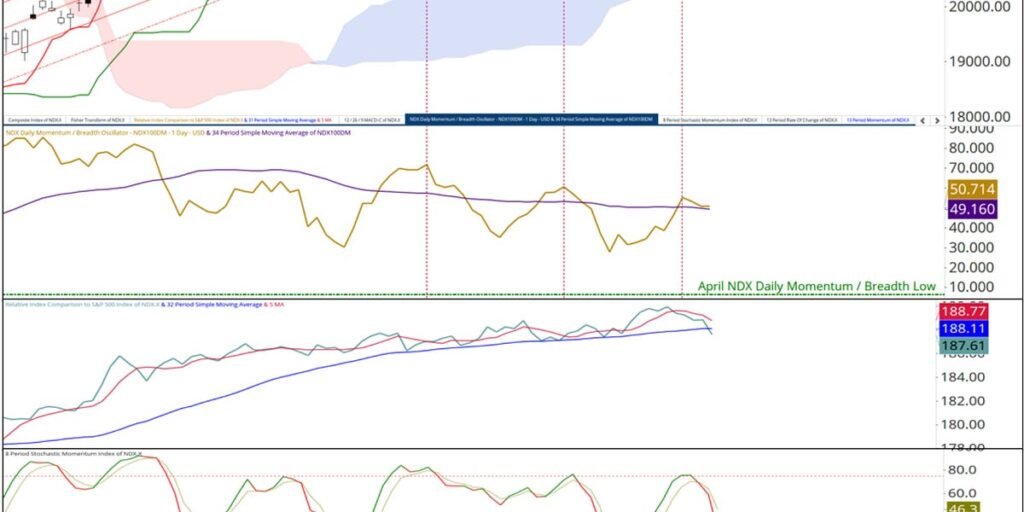
At the risk of being labeled the boy that cried wolf, there are early signs of a crack in the back of the NASDAQ 100 Index’s rally. These include a violation of the Lower Warning Line (dashed red line, LWL) of the Standard Pitchfork (red P1 through P3) after failing to hold the retaken ground above the Lower Parallel (sold red line). I know I’ve been beating a dead horse for weeks, but there continues to be a repeated non-confirmation of the higher price highs in the Momentum / Breadth Oscillator (dashed yellow lines). Not only does it reflect deterioration in upside momentum, but it also speaks to decaying breadth. There are early signs of a break of the trend in relative outperformance versus the SPX as witnessed by a drop below its longer-term moving average (blue line) for the first time in months (a drop of the shorter-term moving average, red line through the longer, would confirm the breakdown). There has been a sharp turn lower in the Stochastic Momentum Index (bottom panel) that at the very least suggests a potential deeper price retracement than we have seen in months. There is no question that I am sticking my neck out with this warning considering that over the next three days there could be news driven volatility in the rates market that will likely overflow into the equity markets. Key support is at the Kijun Plot (green line at 23,320) and second at Cloud support.

