

Stock Market Analyst
📅 Last Updated: March 18, 2026
Introduction (Read This Before You Draw Your First Angle)
If you’ve been exploring Gann theory, you’ve probably felt two extremes at the same time: fascination and frustration. Fascination—because Gann’s name is attached to “market prediction,” geometric angles, mysterious squares, and stories of almost supernatural accuracy. Frustration—because the moment you try applying it on a real chart (Nifty, Bank Nifty, or your favourite midcap), the lines either “fit perfectly” in hindsight… or look completely random in live markets. The research problem is real: most online content either worships Gann like a guru, or dismisses him as pure numerology—leaving serious Indian retail traders stuck in confusion.
Let me set expectations upfront, mentor-to-mentee style. I’m Indrajit Mukherjee—trading and investing since 2002, building StockManiacs.net since 2008, and mentoring thousands of traders across India. In all these years, the biggest damage I’ve seen isn’t from “bad indicators.” It’s from certainty addiction—the belief that a secret tool will remove the need for discipline, risk control, and screen time. Gann theory is especially vulnerable to that trap because it looks scientific (geometry, degrees, grids), but it can also become dangerously subjective if you don’t treat it like a framework rather than a fortune-telling machine.
So in this guide, we’ll do something most Gann articles don’t: we’ll make it practical for Indian traders and honest about limitations. You’ll learn what Gann theory actually is, who W.D. Gann was (including the myth vs reality angle), the core concepts (price–time balance, cycles, geometry), and how a Gann chart is read in real trading workflows. We’ll also cover how traders use it today on platforms like TradingView, where scaling mistakes can silently ruin everything. And yes—there will be a clear “what works / what doesn’t” section so you can protect your capital and your time.
By the end, you won’t need “belief.” You’ll have a structured way to decide whether Gann belongs in your trading system—alongside position sizing, risk limits, and India-specific realities like weekly expiry volatility, circuit filters, and news-driven gaps.
SECTION 1: What Is Gann Theory (Foundation)
Gann theory is a technical analysis approach developed by W.D. Gann that studies the relationship between price, time, and pattern. The central idea is simple to say but hard to apply: markets move in repeating structures, and major turning points tend to occur when specific price levels and time cycles align—especially on properly scaled charts.
The core promise (and the practical interpretation)
In modern terms, think of Gann theory as a market-structure toolkit:
It tries to map where price is likely to react (support/resistance) using angles and grids
It tries to map when reactions are more likely using time cycles and “anniversary” dates
It encourages you to watch the market through a “price-time balance” lens, not just indicators
Some traders treat it like a predictive system. I recommend treating it like a context system: it can help you frame trades (levels + timing windows), but execution still needs confirmation (trend, volume, price action) and strict risk rules.
Why traders still use it (even in 2026)
Because Gann tools solve a real pain:
Horizontal levels alone don’t explain diagonal market structure (trend speed)
Many reversals happen around time-based behaviours (earnings cycles, policy meetings, expiry dynamics)
Traders crave frameworks that reduce randomness into repeatable checkpoints
Gann gives that—provided you don’t turn it into a belief system. And yes, proper scaling matters so much that entire Gann debates exist just because people draw the same tool on different chart settings and get different outcomes.
For a mainstream overview of Gann indicators and the scaling caveat, you can also read this reference.
SECTION 2: W.D. Gann Biography — The Man Behind the Methods
W.D. Gann’s story is a big reason the methodology attracts so much mystique. According to a commonly cited biography, William Delbert Gann was born on June 6, 1878, near Lufkin, Texas, raised on a farm, and had limited formal schooling. He began his market career by working in a brokerage setting while studying business at night—an early hint that he was more “market researcher” than “lucky punter.”
From Texarkana to New York: career shift and publishing influence
The same biography notes that Gann moved to New York City in 1903 and opened his own firm, W.D. Gann & Co. He later published a daily market letter (often referred to as the Supply and Demand Letter) and wrote books such as Truth of the Stock Tape (published in 1924). Whether you agree with his methods or not, his contribution to market education and research culture is undeniable: he made “method” and “forecasting frameworks” a product long before the modern trading-course ecosystem existed.
What he believed (philosophy, not just tools)
Gann’s philosophy—at least as it’s taught today—leans on three themes:
Markets move in cycles
Price and time can be studied through mathematical ratios
Market behaviour follows “natural law” and repeating patterns
This is also where controversy begins. Many discussions around Gann mention astrology and numerology components, and mainstream summaries often call the approach controversial and sensitive to interpretation.
Key achievements… and why controversy follows him
You’ll often hear claims like “Gann predicted the 1929 crash” and achieved extremely high forecasting accuracy. A popular biography even mentions detailed crash forecasting narratives and massive profits.
However, the more critical research view summarised in the blueprint is this: claims of extreme accuracy and massive trading fortune are not strongly supported by rigorous, independently verified records, and sceptics argue that much of the business model may have been education-driven rather than purely trading-performance-driven.
My practical takeaway for Indian retail traders: respect Gann as a historical market thinker, but don’t outsource your risk decisions to his legend. Treat the legend as marketing noise and the tools as optional frameworks.
SECTION 3: Core Concepts of Gann Theory
Gann theory rests on a triad: time cycles, the price–time relationship, and geometry. When traders struggle, it’s usually because they learn the tools (fans, squares) before understanding the logic underneath.
1) Time cycles: “when” matters as much as “where”
Gann analysis often looks for:
repeating cycle lengths
anniversary dates from major highs/lows
divisions of larger cycles (e.g., halves, quarters)
in advanced interpretations, astronomical/planetary references are sometimes mentioned in Gann literature and community discussions.
For Indian traders, here’s the grounded version: time cycles are best treated as time windows, not time certainties. If your cycle says “watch this week,” you still need price confirmation (breakout failure, volume spike, reversal candle, etc.).
2) Price–time balance: the “squaring” idea
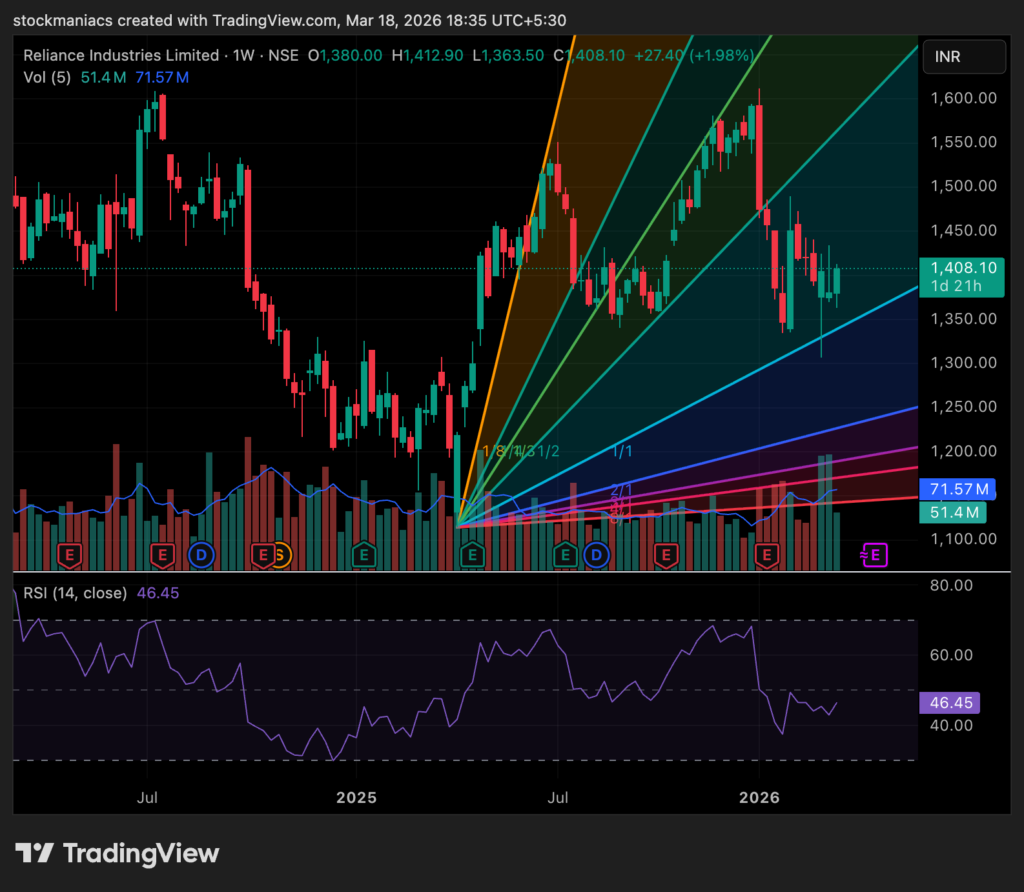
A central Gann claim: significant reversals happen when price and time are in equilibrium—sometimes called “squaring price and time.” The blueprint emphasises that the “ideal” balance is often represented by the 1×1 angle, where price moves one unit for each unit of time.

Zero to Stock Hero
₹149 ₹199
Download

Wealth Multiplier
₹249 ₹299
Download

Multibagger Wealth
₹249 ₹299
Download

Technical Analysis
₹249 ₹299
Download

5-in-1 Mega Bundle
₹649 ₹1,345
Download
3) Geometry in markets: why angles exist in the first place
Instead of asking only “what level,” Gann geometry asks:
At what rate is the price rising or falling?
When does price break the “ideal” rate of trend?
Which angle becomes the next support/resistance?
This is why Gann tools often look clean in a trending market—and messy in a choppy, expiry-driven, headline-driven market like Bank Nifty on a Thursday afternoon.
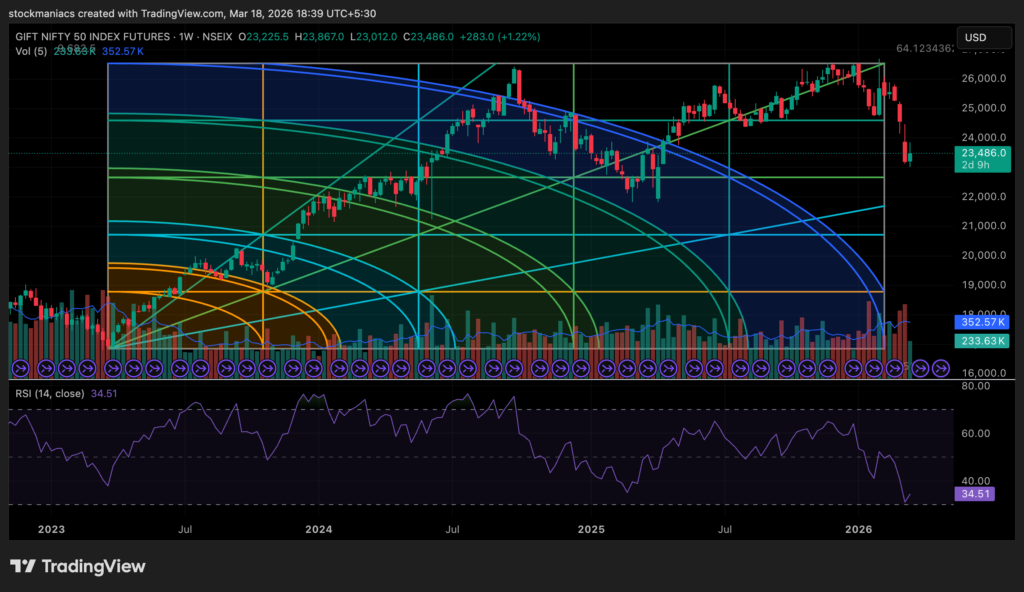
SECTION 4: Gann Chart Explained
A Gann chart isn’t a separate “special chart.” It’s your normal price chart (candles/bars) with Gann constructions layered on top—most commonly:
Gann Angles (single angles)
Gann Fan (a set of angles)
Gann Grid/Box (time–price rectangles)
Square of Nine projections (price targets by degrees)
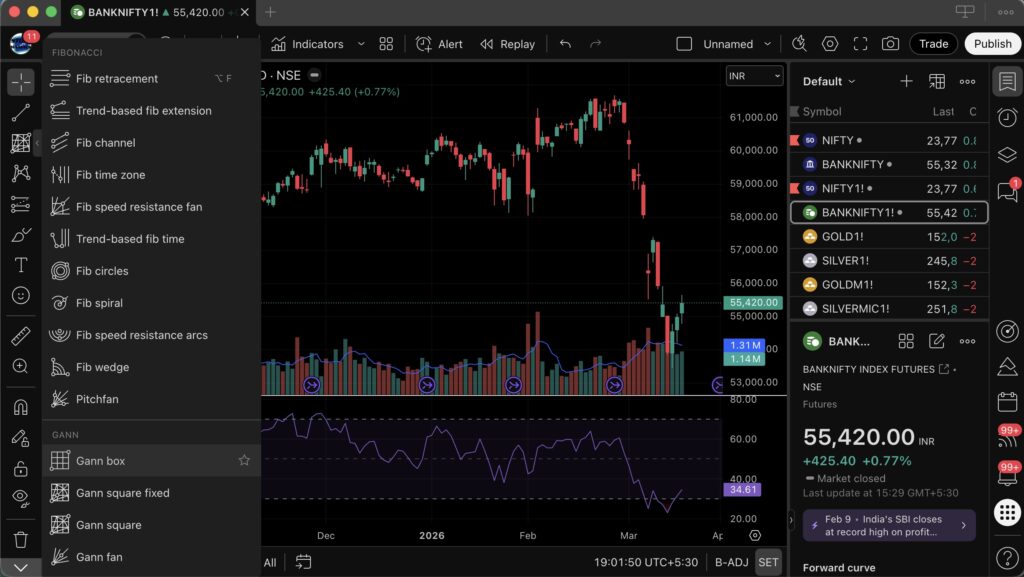
How to Add Gann Tools in TradingView
Adding Gann tools in TradingView is simple once you know where to look.
Open any chart and select your preferred timeframe
Click on the “Drawing Tools” panel on the left
Scroll to the Gann tools section
Choose from:
Gann Fan
Gann Box
Gann Square
Click on the chart to anchor your starting point (usually a swing high or low)
Adjust angles and scale based on your analysis
💡 Tip: Always align your Gann tools with major swing points for better accuracy.
How to read a Gann chart (the part most people skip)
Think in three steps:
Step A: Choose the anchor swing (this is where subjectivity enters)
You draw from a significant swing high/low. If your anchor is wrong, your entire structure shifts. The blueprint calls out anchoring mistakes and hindsight bias as common reasons traders feel “Gann doesn’t work.”
Step B: Respect scaling (or your angles become decorative)
Gann tools depend on the chart being properly scaled so that the geometry is meaningful. If the chart is not squared correctly, a “45-degree” line may not represent the 1×1 relationship at all. Both the blueprint and mainstream summaries emphasise this scaling issue.
Step C: Use angles as a dynamic structure, not a magical prediction
The 1×1 is often treated as the “ideal trend” line. If the price stays above it, the structure is strong; if it breaks and retests fail, the structure weakens. The angle then behaves like a diagonal support/resistance.
A practical Indian-market example (framework, not a guarantee)
Let’s say Nifty forms a clean swing low after a sharp selloff. If you draw a fan from that low:
Price holding above the 1×1 and respecting it on pullbacks = trend strength
Price chopping through multiple angles during weekly expiry volatility = treat angles as “zones,” reduce size, wait for confirmation
A decisive break below 1×1 plus failed retest = trend deterioration; stop pretending it’s still bullish just because a tool “said so”
This is exactly how you protect yourself from tool-worship: you turn Gann into a structure lens and let price action make the final call.
SECTION 5: How Traders Use Gann Theory Today
Modern usage is less about “secret prophecy” and more about workflow:
Map diagonal structure (angles/fans)
Project potential targets (Square of Nine degrees)
Watch timing clusters (cycles + key dates)
Combine with basic confirmation tools (trend filters, swing structure, volume)
The tools and platforms traders commonly use
The blueprint lists platforms and add-ons where traders apply Gann tools, including TradingView, MetaTrader indicators, and specialised software like Optuma, among others.
For Indian retail traders, TradingView is often the most accessible place to start because you can:
Mark swings cleanly
Draw fans/boxes
Back-check quickly across Nifty, Bank Nifty, sectoral indices, and stocks
If you’re learning charting workflows, you may also find these internal guides useful:
A sensible “Gann workflow” I recommend (no hype)
Identify trend on a higher timeframe (daily/weekly)
Anchor fan from a clean major swing
Treat 1×1 as “trend health” line, not entry signal
Use Square of Nine projections as potential targets (for planning R:R)
Execute only when your normal trigger confirms (breakout, pullback, pattern + risk rule)
This aligns with the blueprint’s recommendation to bridge believers and sceptics by positioning Gann as a contextual tool—supported by practical setups and realistic validation.
SECTION 6: Limitations, Myths & Truth (Read This Twice)
This is the section that protects your capital.
Myth 1: “Gann is accurate 80–90% of the time”
The blueprint explicitly highlights that such accuracy claims are not backed by peer-reviewed evidence and are often amplified by marketing narratives.
Truth: Without strict rules, almost any drawing tool can look “accurate” after the move happens.
Myth 2: “If it didn’t work, you scaled it wrong—so keep adjusting”
Yes, scaling matters. But “infinite adjustment” becomes hindsight-fitting.
Truth: If a method requires endless discretionary tuning, it’s not a method—it’s a story.
Myth 3: “Gann is purely scientific geometry”
Mainstream summaries describe the approach as controversial and often associated with mystical elements; this contributes to scepticism and inconsistent practice.
Truth: Some parts are geometric. Some parts are interpretive. Your job is to separate what you can test from what you can’t.
The biggest practical limitation: subjectivity
A quant-style critique of Gann fan strategies is blunt: meaningful backtesting is difficult because rules become too subjective, and there’s no rule forcing price to respect a specific angle.
So what actually “works” in real trading? Here’s the balanced view I’ve seen across Indian traders:
Works best as a structure: diagonal S/R, trend speed context
Works poorly as prophecy: exact tops/bottoms without confirmation
Works only with risk control: small predefined risk, clear invalidation
Works better on clean swings: trending phases, less noise
Works worse in event chaos: RBI surprises, gap opens, expiry spikes
Consumer-protection reality (India-specific warning)
The blueprint flags a real ecosystem issue: Gann is often used to sell expensive courses/indicators with “secret decoding.” It recommends buyer checklists and consumer-protection guidance as a differentiator for honest content.
My rule: if the pitch sounds like “certainty,” assume it’s selling dopamine, not skill. Use free tools, test slowly, and never pay large amounts of money until you’ve validated the workflow in your own journal.
If you want a simple discipline layer around any tool, keep your risk process tight (this checklist mindset matters more than any angle):
Conclusion (How to Use Gann Theory Like a Pro, Not a Believer)
If you remember only one thing from this guide, let it be this: Gann theory is not a prediction machine—it’s a structural framework. At its best, it helps you think in a more complete way: not just “where price might react,” but “when it’s more likely to react,” and “what trend speed is healthy versus broken.” That alone can improve discipline, especially for Indian traders dealing with information overload, social-media tips, and the emotional turbulence of weekly expiry markets.
But Gann only becomes useful when you remove the mythology. The blueprint stresses “no-hype, no-guru” positioning for a reason: the space is full of exaggerated claims, subjective drawings, and expensive add-ons that promise certainty. The truth is more grounded. Gann angles, fans, and the Square of Nine can highlight potential zones and targets—yet they can’t replace confirmation, risk rules, and an honest review of your own execution.
Here’s the action plan I’d recommend (especially if you’re a beginner-to-intermediate trader in NSE/BSE markets):
Start with one tool only: learn the 1×1 concept and a basic Gann fan workflow
Fix your process: pick consistent swing anchors, document your chart settings, and stop re-drawing until it “fits”
Treat outputs as planning levels, not entry commands
Combine with your existing edge: trend filter + price action trigger + predefined stop
Validate slowly: 20–30 chart replays, then 20–30 live forward observations with a small size
Only then, explore Square of Nine projections or time-cycle windows
If you do this, Gann stops being confusing—and becomes what it should have been all along: a structured way to organise uncertainty. And in trading, organising uncertainty is the closest thing we get to a real advantage.
If you want a related framework that many traders connect to Gann-style thinking, you can explore Murrey Math (often discussed as Gann-inspired levels): https://www.stockmaniacs.net/murrey-math-trading-system/
Try the Gann Square of 9 Calculator (Free Tool)
If you’re serious about applying Gann Theory in real trading, you need more than just concepts — you need the right tool.
Our Gann Square of 9 Calculator helps you instantly identify:
Key price levels
Support & resistance zones
Hidden price-time relationships
✅ Now supports:
💡 Pro Tip: Use this tool alongside Gann price-time analysis to significantly improve your trade timing.
FAQ Section
Gann theory is a way to analyse markets using price, time, and geometry. Instead of focusing only on indicators, it tries to map where price may react (levels/angles) and when reactions may cluster (cycles). Used sensibly, it’s a structured tool. Used blindly, it becomes hindsight drawing. The most practical part for beginners is learning the 1×1 idea (price–time balance) and using angles as dynamic support/resistance.
It can be helpful, but it’s not “90% accurate” in any reliable, universally proven way. The blueprint highlights that extreme accuracy claims aren’t supported by rigorous evidence and that the method is often subjective and hard to systematise. If you want reliability, treat Gann outputs as potential zones and combine them with confirmation + risk management.
A Gann chart is a normal price chart with Gann tools (fan/angles/box) overlaid. In practice: pick a major swing high/low, draw a Gann fan, then watch how the price behaves around key angles (especially 1×1). Use it to judge trend strength, plan support/resistance zones, and set “if/then” trade plans—never as a standalone entry trigger. Scaling and anchoring discipline are essential.
W.D. Gann (William Delbert Gann) was an early 20th-century trader, researcher, and author known for geometric/time-based market methods. A commonly cited biography notes he was born in 1878 in Texas, moved to New York in 1903, and published market letters and books like Truth of the Stock Tape. His legacy is influential—but also controversial due to disputed performance claims.
The Square of Nine (Spiral Chart) is a number spiral used to project price targets using degree relationships like 45°, 90°, 180°, and 360°. The blueprint highlights that many traders use calculators where you input a price and get these projections instantly—but confusion about “how to derive actionable targets” is a common pain point.